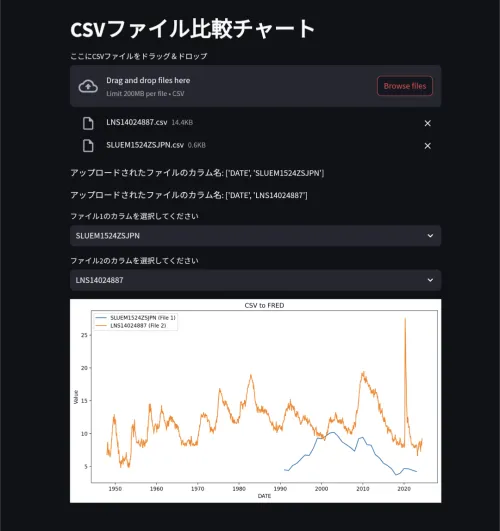
Created an easy-to-use chart comparison and image output tool with Streamlit
https://fred.stlouisfed.org/series/SLUEM1524ZSJPN
You can create a comparison chart on shamboozie.com from the CSV download of the St. Louis Fed linked above.
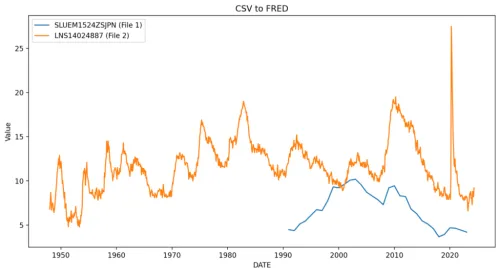
I'm too tired to figure out what 'csv to fred' means, so I'll fix that later.
It supports up to 10 files. I can't adjust data scales yet, but I'm motivated to implement it.
That's all for now.