Displaying System Information in Kibana with OpenTelemetry Collector + Elastic APM (with Elasticsearch)
Hello, I'm incompetent.
I tried to get system information.
This was triggered by learning about OpenTelemetry,
and I also saw ❄ Home server with NixOS and Raspberry Pi | Part 5 Obtaining CPU temperature as metrics, so eventually I'd like to get CPU temperature metrics too...
As a step along that path, I'm giving it a try.
Installation
In the previous article, I have installed Elasticsearch and Kibana, so this time I will install OpenTelemetry Collector and Elastic APM.
Also, as usual, I'm managing daemons with Supervisor, so if you follow the article, anyone should be able to succeed... I think.
Before that, I will configure the elastic user.
cd /usr/share/elasticsearch/
bin/elasticsearch-setup-passwords interactive
This will create several elastic-related users, so make sure to set their passwords properly.
Then, in vim/elasticsearasticsearch.yml
xpack.security.enabled: true
xpack.security.authc.api_key.enabled: true
add the following.
Now, finally, let's install opentelemetry-collector. Get the .deb package from the link below.
httpithub.cen-telemetentelemetry-collector-releasleases
wget https://github.com/open-telemetry/opentelemetry-collector-releases/releases/download/v0.109.0/otelcol_0.109.0_linux_amd64.deb
sudo dpkg -i  otelcol_0.109.0_linux_amd64.deb
Next, install Elastic APM Server.
httpww.elastic.i/arvtup-repositories.html
wget -qO - https://artifacts.elastic.co/GPG-KEY-elasticsearch | sudo apt-key add -
sudo apt-get install apt-transport-https
echo "deb https://artifacts.elastic.co/packages/7.x/apt stable main" | sudo tee -a /etc/apt/sources.list.d/elastic-7.x.list
sudo update-rc.d apm-server defaults 95 10
Now, configure apm-server. vim/apm-servm-server.yml
apm-server:
  host: "0.0.0.0:8200"
  protocol: "http"
  username: "elastic"
  password: "elastic user password"
  rum:
    enabled: true
  ilm:
    enabled: "auto"
output.elasticsearch:
  username: "elastic"
  password: "elastic user password"
instrumentation:
  enabled: true
setup.kibana:
  host: "kibana:5601"
It's a bit late to ask, but I wonder if this configuration is correct...
Next, the opentelemetry-collector configuration. Since I'll be changing quite a bit, I'll edit it after backing it up once.
sudo cp -p /etc/otelcol/config.yaml /etc/otelcol/bak.config.yaml
sudo vim /etc/otelcol/config.yaml
receivers:
  hostmetrics:
    collection_interval: 10s
    scrapers:
      cpu:
      memory:
      disk:
      filesystem:
      network:
      load:
      paging:

processors:
  batch:

exporters:
  otlp:
    endpoint: "localhost:8200"
    tls:
      insecure: true

service:
  pipelines:
    metrics:
      receivers: [hostmetrics]
      processors: [batch]
      exporters: [otlp]
  telemetry:
    logs:
      level: "info"
    metrics:
      level: "detailed"
      address: "0.0.0.0:8888"
What really got me was the insecure: true part, it wouldn't work no matter what if I didn't include it...
A daemon script was created in init.d, but it didn't work properly, so I'll set it up with Supervisor.
Regarding the daemon execution command, please confirm the correct path using which.
This is for APM-Server
sudo cat /etc/supervisor/conf.d/apm-server.conf
[program:apm-server]
command=/usr/bin/apm-server -e -c /etc/apm-server/apm-server.yml
autostart=true
autorestart=true
redirect_stderr=true
stderr_logfile=/var/log/apm-server/apm-server.error.log
stdout_logfile=/var/log/apm-server/apm-server.out.log
user=apm-server
This is for opentelemetry-collector
sudo cat/supervisnfelcol.conf
[program:otelcol]
commanr/belcol --confic/otelcnfig.yaml
autostart=true
autorestart=true
stderr_logfilr/lelcelcol.err.log
stdout_logfilr/lelcelcol.out.log
user=otel
environment=OTEL_EXPORTER_OTLP_ENDPOINT="httocalhost:4317"
Regarding OTEL_EXPORTER_OTLP_ENDPOINT
Apply with Supervisor.
sudo supervisorctl reread
sudo supervisorctl update
sudo supervisorctl start apm-server
sudo supervisorctl start otelcol
Also, just in case, please restart elasticsearch and kibana.
Check from Kibana in your browser
If you have successfully connected to the APM server, you should be able to check it from Observability -> APM.
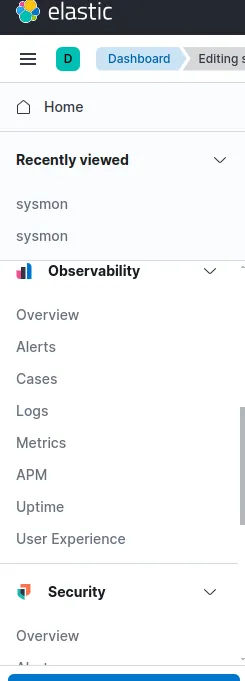
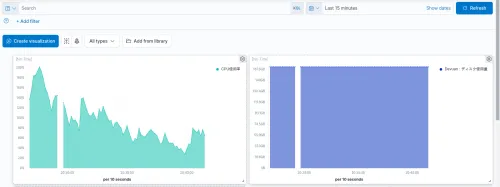
Also, you can configure it like this from Analytics -> Dashboard.
I stumbled here,
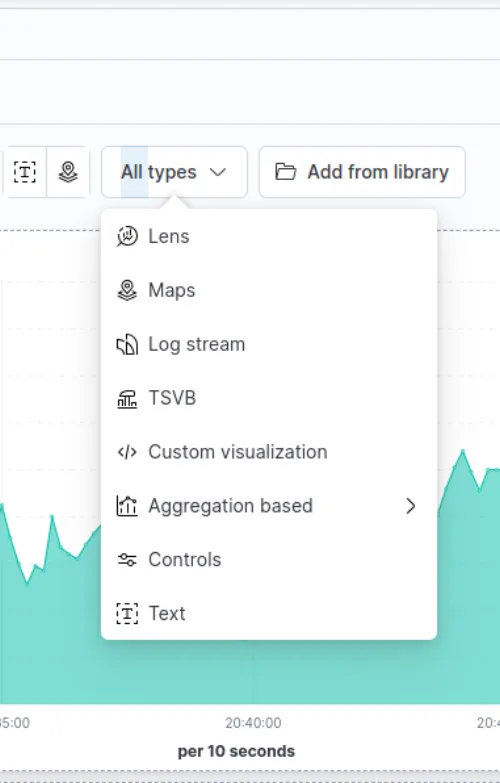
from TSVB here.
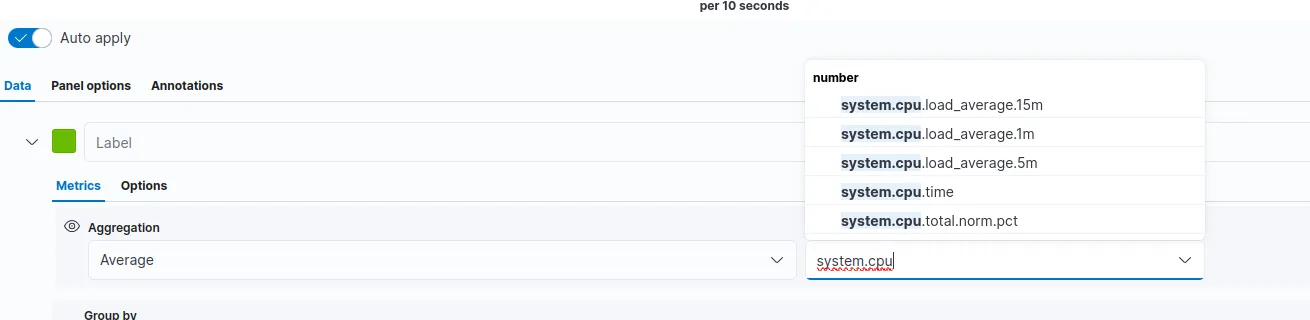
If you select this, it will be displayed. Also, if the display is strange, touching the chart part will automatically change the displayed timestamp, so from the top right
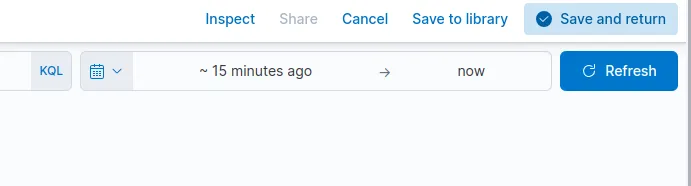
please change the time axis from here.
Somehow, I just fiddled with it and half a day disappeared.
See you next time.
Best regards. (I was slacking off drinking, so here's a flurry of 3 article updates!)