Memo - PINE Code
https://www.tradingview.com/script/wf7E7MWQ-Bitcoin-CME-Futures-Friday-Close/
Here we go.
I've created an ETH version of the CME gap visualization code.
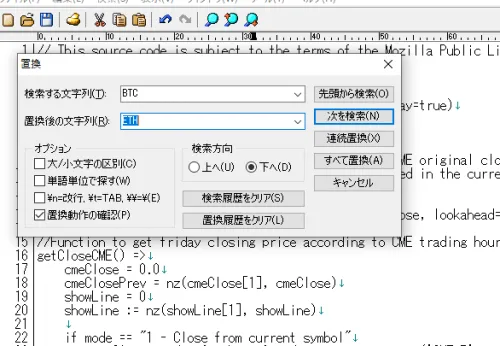
It's easy, just replace BTC with ETH in Terapad.
// This source code is subject to the terms of the Mozilla Public License 2.0 at https://mozilla.org/MPL/2.0/
// c LeanWave

//@version=5
indicator('Ethereum - CME Futures Friday Close', overlay=true)
mode = input.string(
     defval="1 - Close from current symbol",
     title="Mode",
     options=["1 - Close from current symbol", "2 - CME original close crice", "3 - CME settlement price"],
     tooltip="In Mode 1 the closing price is determined in the current symbol but with the tradinghours from the CME futures contract. Mode 2 and 3 obtain the price directly from the CME futures contract and paint it in the chart of the current symbol. But note, that modes 2 and 3  may not give you the expected result, due to price differences in futures and spot prices.")

cme = request.security("CME:ETH1!", "60", close)
cmeSettlement = request.security("CME:ETH1!", "D", close, lookahead=barmerge.lookahead_on)

//Function to get friday closing price according to CME trading hours
getCloseCME() =>
    cmeClose = 0.0
    cmeClosePrev = nz(cmeClose[1], cmeClose)
    showLine = 0
    showLine := nz(showLine[1], showLine)

    if mode == "1 - Close from current symbol"
        cmeClose := dayofweek == 6 and time == timestamp('GMT-5', year, month, dayofmonth, 16, 0, 0) ? close[1] : cmeClosePrev
    else if mode == "2 - CME original close crice"
        cmeClose := dayofweek == 6 and time == timestamp('GMT-5', year, month, dayofmonth, 16, 0, 0) ? cme : cmeClosePrev
    else if mode == "3 - CME settlement price"
        cmeClose := dayofweek == 6 and time == timestamp('GMT-5', year, month, dayofmonth, 16, 0, 0) ? cmeSettlement : cmeClosePrev
    showLine := showLine == 0 and time >= timestamp('GMT-5', year, month, dayofmonth, 16, 0, 0) and dayofweek >= 6 ? 1 : showLine == 1 and dayofweek <= 1 and time >= timestamp('GMT-5', year, month, dayofmonth, 17, 0, 0) ? 0 : showLine

    [cmeClose, showLine]

[cmeClose, showLine] = getCloseCME()

//Plotting
plot1 = plot(showLine == 1 ? cmeClose : na, 'CME Friday Close', style=plot.style_linebr, linewidth=2, color=color.new(color.blue, 0))
plot2 = plot(close, 'Dummy plot for background', color=na)
fill(plot1, plot2, title='Background', color=close > cmeClose ? color.new(color.green, 80) : close < cmeClose ? color.new(color.red, 80) : na)
The above is the ETH replacement code.
You can use it by simply pasting it into TradingView's PINE editor.
The CME gap refers to the price returning to its previous level when the Chicago Mercantile Exchange reopens after closing, so it seems quite useful.
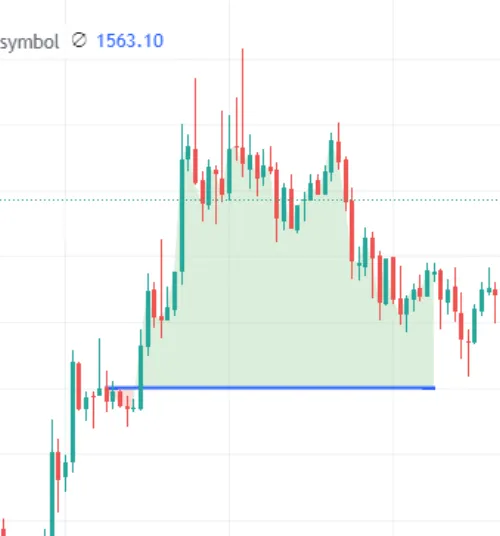
Blue → Decline with a downward gap due to overvaluation after market close.
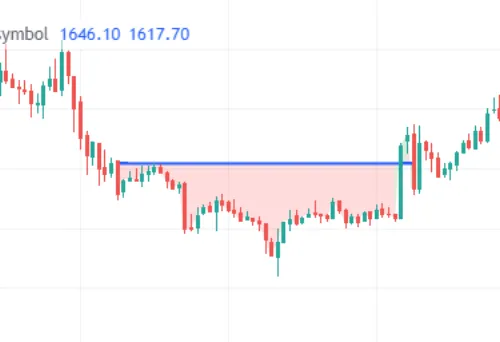
Red = Rise with an upward gap due to undervaluation after market close.
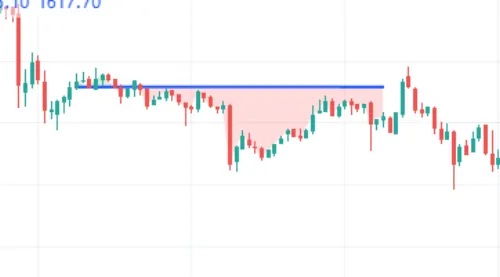
Likewise.
Developing a bot to allow for weekday rotation.