My easy way to check listening ports and output used ports and services
Hello, I'm incompetent.
Oh dear, a phrase that I seem to have heard somewhere before is being used in the title...
Even now, I sometimes think that's a good site name. These days, I just got a perfect low blood pressure reading of 60-100 at my health check-up.
The second measurement was definitely low blood pressure, so naturally, the first measurement was used.
Introduction
Suddenly,
I thought, "I want to output the used ports and their services in an easy-to-understand way."
This is because
- When operating personally, I want to easily check and output without needing a server configuration diagram.
- I want to output in Markdown format or as a text file.
- Checking used ports
Honestly, as I run more and more things myself, I often forget which ports I'm using.
As this happens more often, once I have a certain amount of information I need, I want to script it to easily check it as a .md file.
By the way, the reason I'm particular about text files is because
data handling becomes easier.
I will write about this point later.
Simply by typing just this one command
lsof -i -P -n | grep "LISTEN" | awk '{print $1 "," $3 "," $9}' | sort | uniq
and then you get
$ lsof -i -P -n | grep "LISTEN" |  awk '{print $1 "," $3 "," $9}' | sort | uniq
pulseaudi,haturatu,*:38169
pulseaudi,haturatu,*:44409
pulseaudi,haturatu,*:4713
It outputs like this.
By the way, the output is the same even without lsof options, but it seems to be different in the BSD version, so I'm including all options.
CSV Conversion
Although various things are often said about file formats, I personally like the CSV format.
Honestly, I don't think CSV is bad when dealing with CSV files. The only obvious thing is that if you replace commas with sed, and a comma is used within a string, that will also be replaced.
TSV is not yet generally familiar, so CSV is better. (Honestly, if replacing with sed, which would have fewer errors, comma or tab...)
I've strayed a bit from the topic, but if you easily convert it to CSV, you can copy and paste it directly into Excel, and even just opening it provides high readability.
You can easily open it in LibreOffice or similar by simply redirecting standard output to a .csv file. Next, I'll add TCP/UDP information.
$ lsof -i -P -n | grep "LISTEN" | awk '{print $1 "," $3 "," $9 "/" $8}' | sort | uniq > test.csv
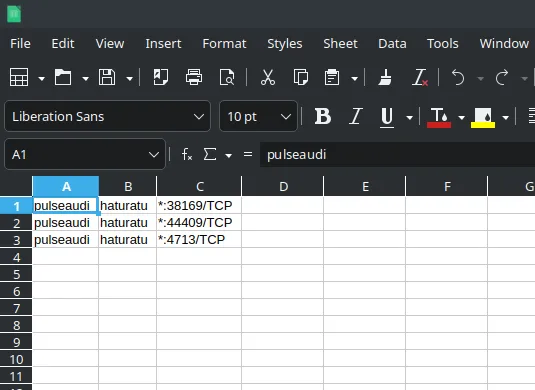
It looks like this,
If you do this,
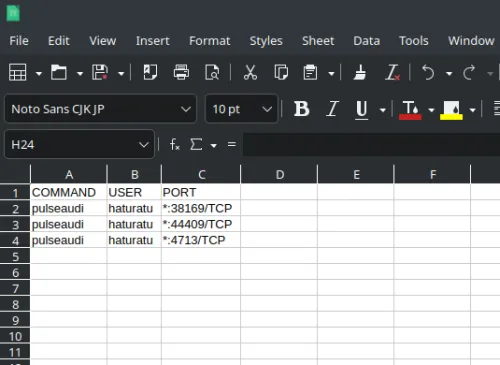
it might be relatively easy to visualize.
Honestly, at first, I was crudely outputting with `print " "` without using spaces like `printf %10s`, but as a command intended for CSV format, I feel it's clearer and easier to read if you eventually pipe it to the column command...

If converting to Markdown format
At first, I thought about following the Markdown format and creating a table, but I'm not really fond of Markdown tables, so I figured using "```" would be fine for easy copy-pasting.
If necessary, I'll print and output with awk.
The purpose of outputting in Markdown format is that if I run it as a cron job to regularly push to a private repository on GitHub or similar, I can easily check it anytime.
Considering other necessary things
Next, for checking disk capacity, there's df -h, vmstat, free, etc., but that leans more towards system-wide resource monitoring, so perhaps pulling information from /proc/cpuinfo, /proc/meminfo, and so on...
It would be even better if DB table information could be easily visualized. If I were to do that, I could run DB-related commands to some extent with `which *` and only output specific DB information for those that return status code 0, which would be even more thorough. But I'm quite reluctant to do that.
Configuration diagrams tend to vary quite a bit from person to person, and while I understand that detailed design documents for middleware products are certainly necessary, it's difficult to check the overall system if it's not consolidated into one place, so I'm wondering if there's a way to manage it more easily personally.
It's easy to create diagrams with tools like draw.io, but I also want to reduce the verification cost involved in creating those diagrams.
Bonus: The Silence of Wireguard
By the way, while doing this, I wondered why lsof wasn't showing Wireguard, even though it was running as UDP51820. I found the answer.
the wireguard not listening on port after started
Raspberry Pi で WireGuard + VPS
It seems to be because it functions as a kernel module. From my own interpretation, Wireguard operates at Layer 3, and "lsof" only "displays files opened by processes," so I wondered if that's why it doesn't show up. Am I wrong?
By the way, Red Hat's Japanese documentation is quite easy to understand.
Chapter 8. Setting up a WireGuard VPN
So, that's all for today. If I think of anything else good, I might write a continuation, or I might not.
Until next time.